Tất cả các bài viết liên quan đến IT, Infrastructure: Sysadmin, Cloud & DevOps...chuyển qua https://infra.lecuong.info/

Bài viết với chủ đề: pnp4nagios

Hướng dẫn cài đặt RRDTool 1.7.0

HOW TO INSTALL RRDTOOL 1.7.0 CENTOS

Hệ thống monitoring Nagios (kết hợp check_mk, pnp4nagios) sử dụng rrdtool để vẽ biểu đồ thông tin hệ thống.


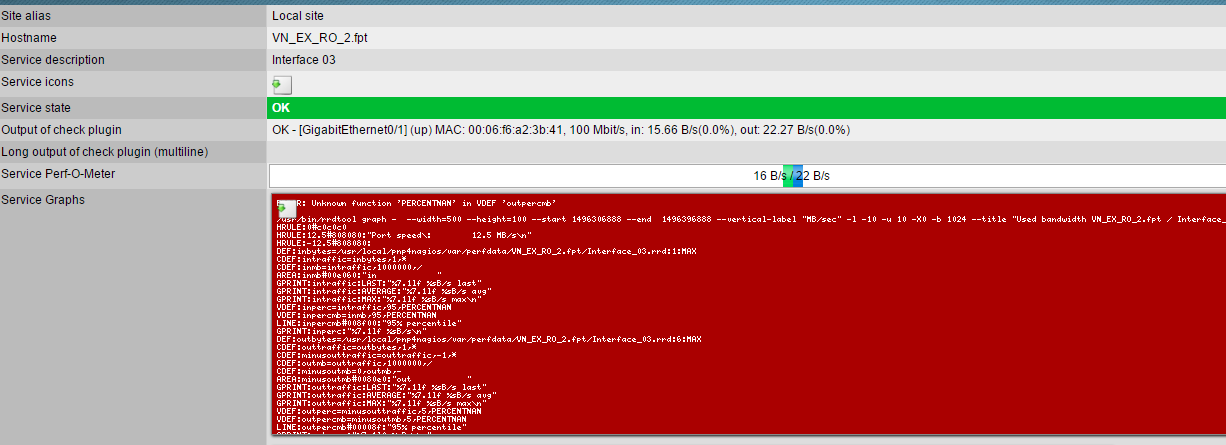
Trong một trường hợp tôi tình cờ phát hiện graph theo dõi băng thông trên một vài interfaces bị lỗi không thể hiển thị:


Sau khi kiểm tra, tôi đã fix lỗi thành công:


GIẢI PHÁP GIÁM SÁT DATABASE ORACLE MIỄN PHÍ

Tiếp theo loạt bài về giải pháp giám sát với Nagios. Trong bài viết này, tôi sẽ hướng dẫn cấu hình các thông số trên Nagios (Check_MK) để giám sát cơ sở dữ liệu Oracle ở môi trường Linux/Unix (AIX)

Về các thông số sẽ lấy từ db Oracle như sau:


oracle_instance Check various aspects of an Instance
oracle_asm_diskgroup Check various aspects of ASM Disk-Groups
oracle_dataguard_stats Check various aspects of Data-Guard state
oracle_jobs Check various aspects of Scheduler Jobs
oracle_locks Check various aspects of Instance Locks
oracle_logswitches Check various aspects of Logswitches
oracle_longactivesessions Check various aspects of Long Active Sessions
oracle_performance Ger various Performance data from an Instance
oracle_processes Check various aspects of ORACLE Processes
oracle_recovery_area Check various aspects of the Fast Recovery Area
oracle_recovery_status Check various aspects of the Recovery State
oracle_rman_backups Check various aspects of RMAN Backups
oracle_sessions Check various aspects of Sessions
oracle_tablespaces Check various aspects of Tablespaces
oracle_undostat Check various aspects of Undo Statistics

......

Để giám sát chi tiết các thông số trên host, chúng ta cần cần cài đặt Agent tương ứng với từng OS là Linux/AIX/Windows. Việc cài đặt Agent lên host khá đơn giản nên tôi sẽ không đề cập nhiều, chỉ tập trung vào các thông số cấu hình cần thiết.

GIẢI PHÁP GIÁM SÁT HẠ TẦNG MẠNG MIỄN PHÍ VỚI NAGIOS - UPDATE2

CẬP NHẬT NAGIOS CORE, NAGIOS PLUGIN CHECK_MK, PNP4NAGIOS

Chào các bạn,
Tiếp theo bài giới thiệu về "Giải pháp giám sát hạ tầng mạng miễn phí với Nagios - update1".
Trong bài viết nà, tôi sẽ hướng dẫn update PNP4NAGIO và kiểm tra lại các thông số cấu hình để thu thập dữ liệu tạo chart/graph

1/ Tải file: https://sourceforge.net/projects/pnp4nagios/files/latest/download?source=files

2/ Quăng file pnp4nagios-0.6.25.tar.gz vào /tmp
3/ Thực hiện update:
cd /tmp
tar xvxf pnp4nagios-0.6.25.tar.gz
cd pnp4nagios-0.6.25
./configure
make all
make fullinstall


*** Configuration summary for pnp4nagios-0.6.25 03-01-2015 ***

  General Options:
  -------------------------         -------------------
  Nagios user/group:                nagios nagios
  Install directory:                /usr/local/pnp4nagios
  HTML Dir:                         /usr/local/pnp4nagios/share
  Config Dir:                       /usr/local/pnp4nagios/etc
  Location of rrdtool binary:       /usr/bin/rrdtool Version 1.3.8
  RRDs Perl Modules:                FOUND (Version 1.3008)
  RRD Files stored in:              /usr/local/pnp4nagios/var/perfdata
  process_perfdata.pl Logfile:      /usr/local/pnp4nagios/var/perfdata.log
  Perfdata files (NPCD) stored in:  /usr/local/pnp4nagios/var/spool

  Web Interface Options:
  -------------------------         -------------------
  HTML URL:                         http://localhost/pnp4nagios
  Apache Config File:               /etc/httpd/conf.d/pnp4nagios.conf


*** Main program, Scripts and HTML files installed ***

Enjoy.

[root@vnsysadmin.com pnp4nagios-0.6.25]#
Kiểm tra thử url sau xem chạy không: http://<ip>/pnp4nagios/graph
Nếu mọi thứ OK hết thì xóa file cài đặt:
rm -rf /usr/local/pnp4nagios/share/install.php

4/ Kiểm tra lại các file cấu hình:
Bước này cực kỳ quan trọng:
Verify config:

# wget http://verify.pnp4nagios.org/verify_pnp_config

# perl verify_pnp_config --mode bulk --config=/usr/local/nagios/etc/nagios.cfg --pnpcfg=/usr/local/pnp4nagios/etc

Nếu như thông báo như trên thì lỗi rồi đấy ^^!

5/ Sửa các thông số trên Nagios để cho phép pnp4nagios thu thập dữ liệu:

vim /usr/local/nagios/etc/nagios.cfg

process_performance_data=1

host_perfdata_file=/usr/local/pnp4nagios/var/host-perfdata
service_perfdata_file=/usr/local/pnp4nagios/var/service-perfdata

host_perfdata_file_template=DATATYPE::HOSTPERFDATA\tTIMET::$TIMET$\tHOSTNAME::$HOSTNAME$\tHOSTPERFDATA::$HOSTPERFDATA$\tHOSTCHECKCOMMAND::$HOSTCHECKCOMMAND$\tHOSTSTATE::$HOSTSTATE$\tHOSTSTATETYPE::$HOSTSTATETYPE$\tHOSTOUTPUT::$HOSTOUTPUT$
service_perfdata_file_template=DATATYPE::SERVICEPERFDATA\tTIMET::$TIMET$\tHOSTNAME::$HOSTNAME$\tSERVICEDESC::$SERVICEDESC$\tSERVICEPERFDATA::$SERVICEPERFDATA$\tSERVICECHECKCOMMAND::$SERVICECHECKCOMMAND$\tHOSTSTATE::$HOSTSTATE$\tHOSTSTATETYPE::$HOSTSTATETYPE$\tSERVICESTATE::$SERVICESTATE$\tSERVICESTATETYPE::$SERVICESTATETYPE$\tSERVICEOUTPUT::$SERVICEOUTPUT$
host_perfdata_file_mode=a
service_perfdata_file_mode=a
host_perfdata_file_processing_interval=15
service_perfdata_file_processing_interval=15

host_perfdata_file_processing_command=process-host-perfdata-file
service_perfdata_file_processing_command=process-service-perfdata-file

vim /usr/local/nagios/etc/objects/commands.cfg

define command{
command_name process-service-perfdata-file
command_line $USER1$/process_perfdata.pl --bulk=/usr/local/nagios/var/serviceperfdata
}
define command{
command_name process-host-perfdata-file
command_line $USER1$/process_perfdata.pl --bulk=/usr/local/nagios/var/hostperfdata
}

vim /usr/local/nagios/etc/objects/templates.cfg


define host {
name            host-pnp
action_url      /pnp4nagios/index.php/graph?host=$HOSTNAME$&srv=_HOST_
register        0
}

define service {
name            srv-pnp
action_url      /pnp4nagios/index.php/graph?host=$HOSTNAME$&srv=$SERVICEDESC$
register        0
}

define host {
    use                     linux-server,host-pnp
    host_name               ubuntu
    alias                   ubuntu
    address                 127.0.0.1
}

define service {
    use                             local-service,srv-pnp
    host_name                       ubuntu
    service_description             PING
    check_command                   check_ping!100.0,20%!500.0,60%
}

cp /usr/local/pnp4nagios/etc/rra.cfg-sample /usr/local/pnp4nagios/etc/rra.cfg

service nagios restart.

Chúc các bạn thành công. :)

http://blog.vnsysadmin.com/2017/03/giai-phap-giam-sat-ha-tang-mang-cap-nhat-2.html

GIẢI PHÁP GIÁM SÁT HẠ TẦNG MẠNG MIỄN PHÍ VỚI NAGIOS - UPDATE1

CẬP NHẬT NAGIOS CORE, NAGIOS PLUGIN CHECK_MK, PNP4NAGIOS

Chào các bạn,
Tiếp theo bài giới thiệu về Giải pháp giám sát hạ tầng mạng với Nagios core:

    Monitor your entire IT infrastructure
    Spot problems before they occur
    Know immediately when problems arise
    Share availability data with stakeholders
    Detect security breaches
    Plan and budget for IT upgrades
    Reduce downtime and business losses
 Trong bài viết này tôi chia sẻ các bước cập nhật hệ thống giám sát lên phiên bản mới nhất gồm các thành phần: Nagios core, nagios plugin check_mk, pnp4nagios:

GIẢI PHÁP GIÁM SÁT HẠ TẦNG MẠNG VỚI NAGIOS CORE

Nhân tiện đang nâng cấp hệ thống giám sát hạ tầng mạng cho khách hàng nên tôi cập nhật lại bài viết "IT Infrastructure Monitoring" trước đây từng chia sẻ trên http://www.lecuong.info, http://blog.banbeit.com và một số site khác.
Tham khảo các bài viết cũ tại:
http://www.lecuong.info/2013/06/it-infrastructure-monitoring.html
http://www.lecuong.info/2013/06/it-infrastructure-monitoring-part-1.html
http://www.lecuong.info/2013/06/it-infrastructure-monitoring-part-2.html
Bài viết này sẽ giới thiệu thêm và hướng dẫn nâng cấp hệ thống giám sát trên nền tảng Nagios lên phiên bản mới nhất.


Với Nagios Core (open source) hoàn toàn miễn phí, chúng ta có thể làm được rất nhiều thứ:
System Monitoring: complete monitoring of desktop and server operating systems – including system metrics, service states, process states, performance counters, event logs, applications (IIS, Exchange, Apache, MySQL, etc), and services (Active Directory, DHCP, Sendmail, etc). Nagios supports monitoring of Windows, Linux, Unix, Solaris, AIX, HP-UX, and Mac OS/X operating systems.
Protocol Monitoring (SNMP, HTTP, SSH, FTP, SMTP, Protocol TCP/UDP)....: complete monitoring of network protocols – including TCP/IP and UDP protocols. Implementing effective network protocol monitoring with Nagios offers increased server, services, and application availability, as well as fast detection of network outages and protocol failures.
Application Monitoring: complete monitoring of applications and application state – including Windows applications, Linux applications, Unix applications, and Web applications. Implementing effective application monitoring with Nagios offers the following benefits: increased server, services, and application availability, fast detection of network outages and protocol failures, and fast detection of failed services, processes and batch jobs.
Database Monitoring: complete monitoring of database servers and databases – including availability, database and table sizes, cache ratios, and other key metrics. Implementing effective database monitoring with Nagios offers increased application availability, increased database performance, fast detection of database outages, failures, and table corruption, predictive analysis of storage requirements and index performance.
Log Monitoring
Bandwidth Monitoring
----------

Một số hình ảnh về hệ thống giám sát phiên bản nâng cấp:

Tối ưu hóa hiệu suất hệ thống, tốn ít tài nguyên:


Giao diện trực quan, theo dõi & report chi tiết hơn:


Theo dõi chi tiết thông tin thiết bị mạng:


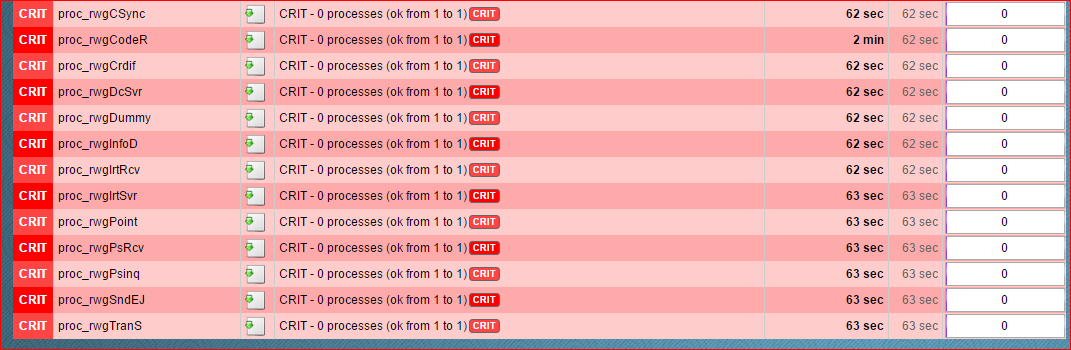
Theo dõi chi tiết trạng thái process:


Các bạn quan tâm, có thể tham khảo thêm về Nagios tại đây.

Hoặc liên hệ trực tiếp với tôi (lecuong@itlab.com.vn) để được tư vấn & hỗ trợ triển khai.

Trong bài viết tiếp theo, tôi sẽ hướng dẫn nâng cấp hệ thống Nagios cũ lên phiên bản mới. :)

http://blog.vnsysadmin.com/2017/03/giai-phap-giam-sat-ha-tang-mang.html